Distance Time Graphs Worksheets – New & Engaging
Distance Time Graphs Worksheets - Practice
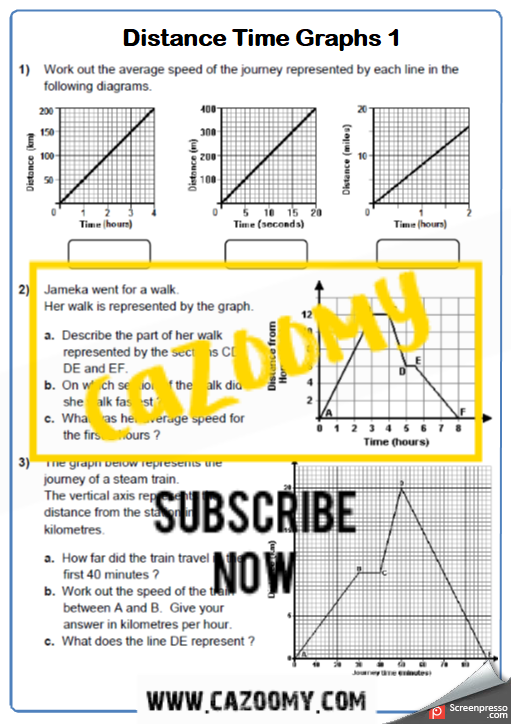
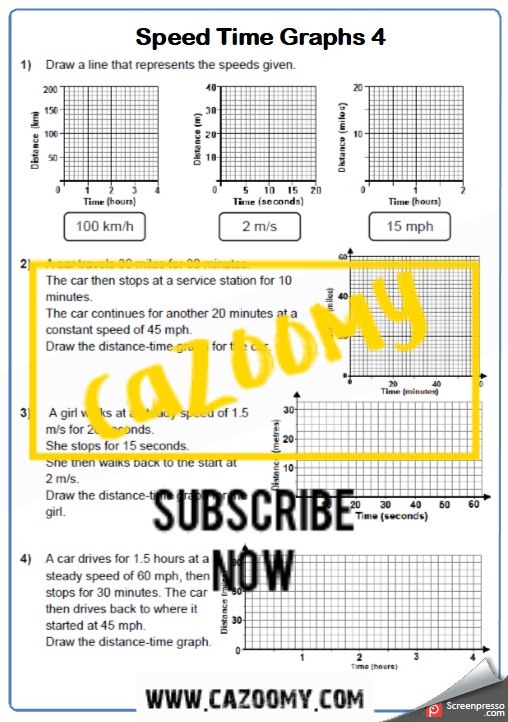
Distance Time Graphs worksheet practice questions for year 9 and year 10. Distance time graphs worksheet 1 contains five questions involving average speed. Distance time graphs worksheet 2 contains four including drawing distance time graphs. shorter questions. Distance time graphs worksheet 3 contain three worded problems of progressive difficulty. All distance time graphs worksheets are suitable for 9-1 GCSE Maths as part of the UK national curriculum as well as international curricula.
What Are The Features of a Distance Time Graph?
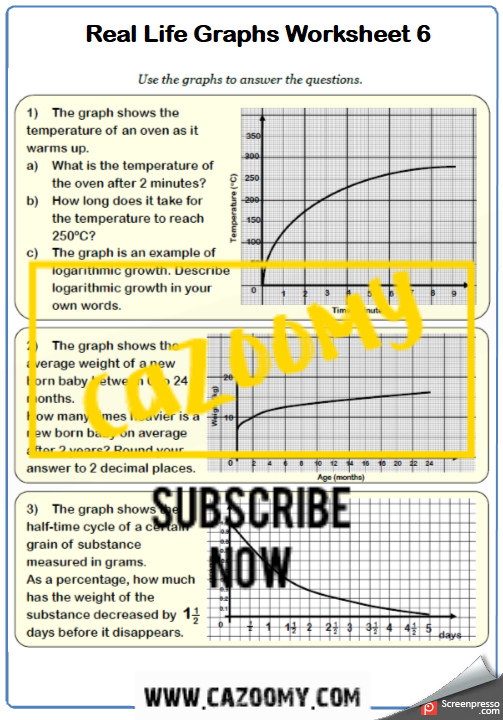
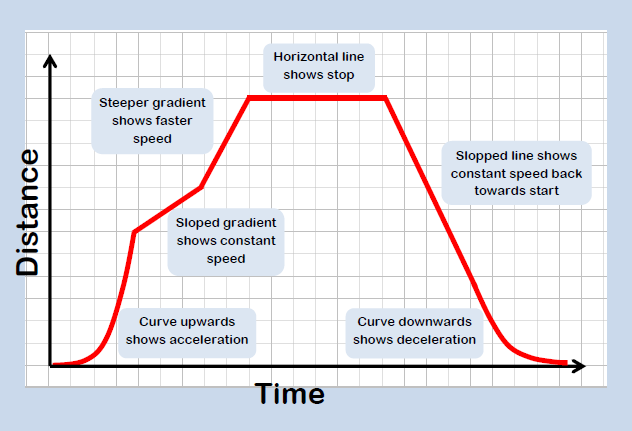
When drawing and reading distance-time graphs we label the x-axis "time" and the y-axis "distance". In this circumstance the y-axis is the dependent variable and the x-axis is the independent variable. You may also like to see the following topics: Real Life Graphs, Speed-Time Graphs.
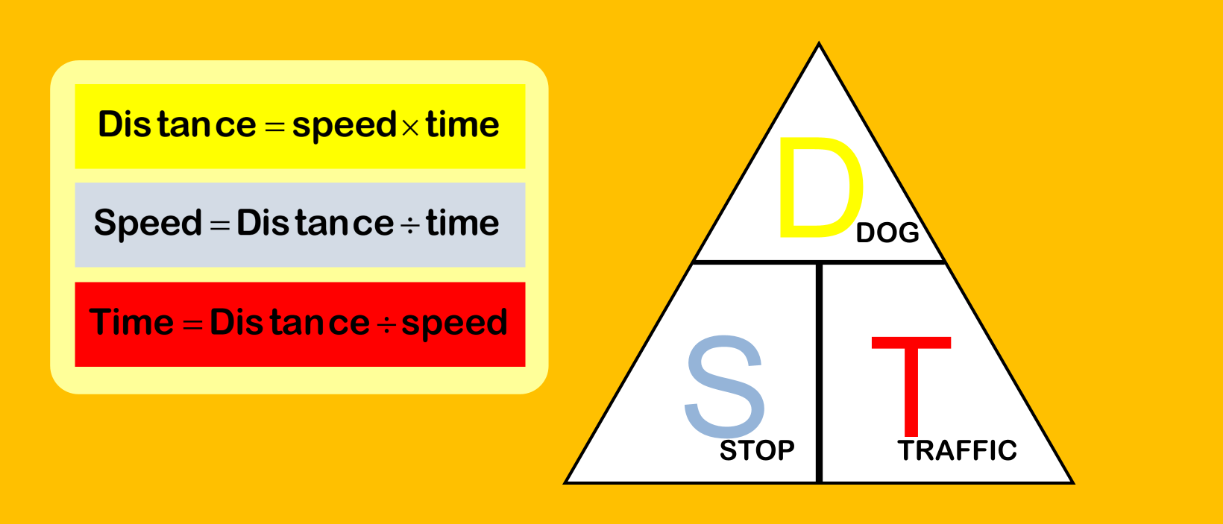
Formula for Distance Speed Time
The graphic below shows the formula for distance speed and time. Distance = speed x time. Speed = distance ÷ time, time = distance ÷ speed. Students must check for the correct units to ensure the final answer is correct. Units for time include: seconds, minutes, hours. Units for distance include, kilometres, metres, centimetres. Units for speed include: km/h (kilometres per hour), mph (miles per hour), m/s (miles per second).

